
When you write firmware for an e-bike controller, the controller wants to know three things all the time: how fast the bike is going, how hard the rider is pushing, and how fast they're pedalling. Speed, torque and cadence. Everything the assistance does depends on them.
The problem was simple. When we started, we didn't have them. The production speed and torque sensors weren't available yet, and even later, putting a complete bike on the bench for every firmware change would have been slow. Worse, it would have been almost impossible to repeat a test exactly. Try pedalling at precisely 64 rpm with exactly the same force twice in a row.
So we built an emulator. The first goal was modest: replace the missing sensors so we could keep developing. It didn't stay modest for long. Today it's a full test platform with sensor emulation, CAN communication, automated tests and data logging.
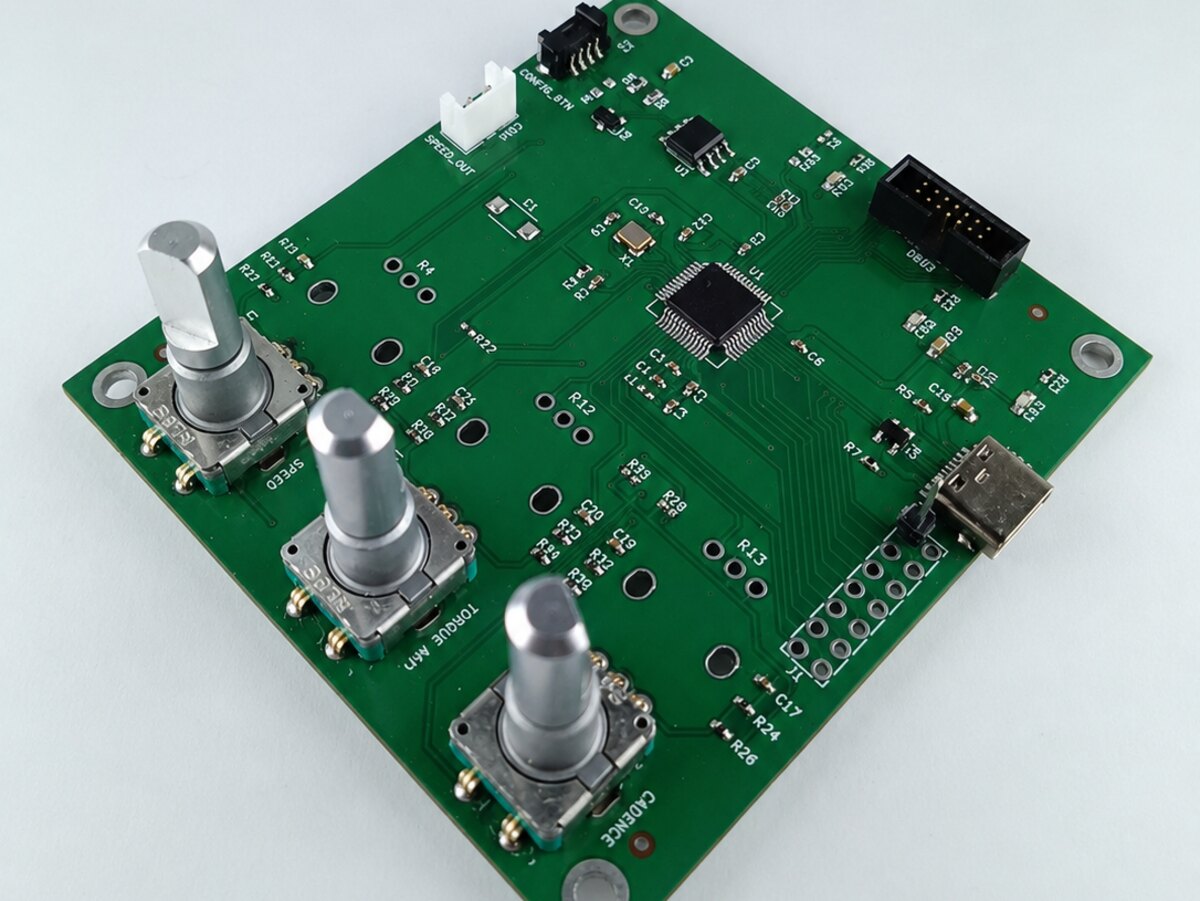
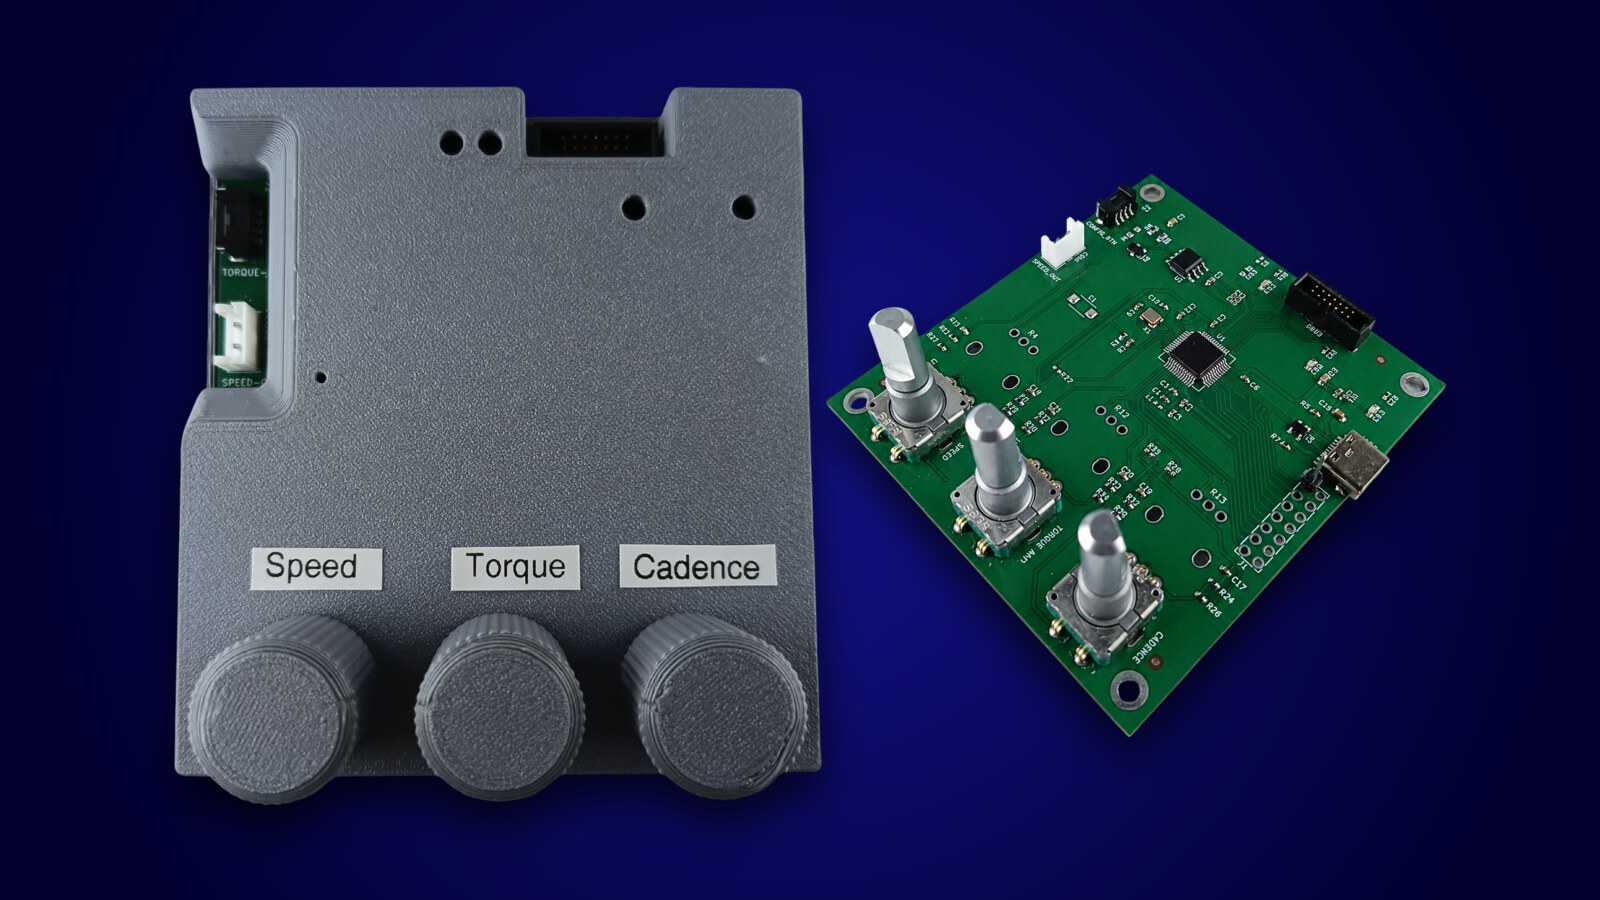
The emulator board: three rotary encoders, a USB-C connection to the PC, and the connectors that go to the controller under test.
The hardware
The emulator is a custom PCB that plugs straight into the e-bike controller we're testing. To the controller, it simply is the bike. It has:
a CAN interface, to talk to the controller and the other nodes on the bus,
a configurable pulse generator that imitates the wheel speed sensor,
torque and cadence emulation, to reproduce what a rider does,
USB, for control from the PC, test automation and data logging,
three rotary encoders for turning speed, torque and cadence up or down by hand.
The encoders turned out to be more useful than we expected. When you're debugging something at the bench, reaching for a knob is much faster than clicking through a GUI. Tarik designed a 3D-printed enclosure around the board with labelled knobs, so it survives life on a busy desk.
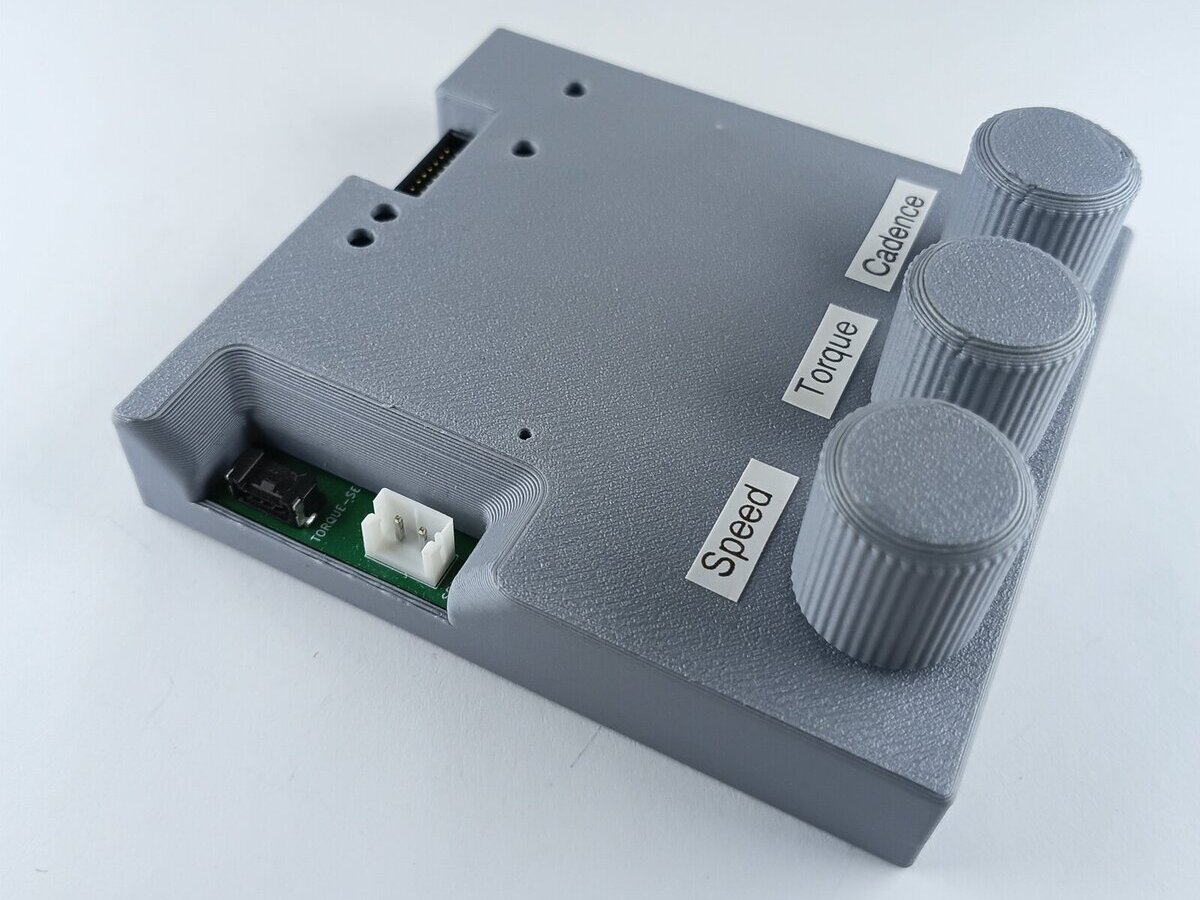
The enclosure, with one knob each for speed, torque and cadence.
How it works is straightforward. The desktop application keeps sending the wanted speed, torque and cadence over USB at a configurable rate, fast enough for quick changes and slow enough for gentle ramps. The emulator firmware turns those numbers into what the bike would normally produce: torque and cadence become the matching CAN messages, and speed becomes a pulse train that looks exactly like the wheel speed sensor's output.
The controller can't tell the difference. That's the whole point: the real controller firmware runs against inputs we fully control and can repeat whenever we want.
The desktop application
Hardware alone isn't enough. To use the emulator every day we wrote a desktop application, which grew screen by screen as new needs came up.
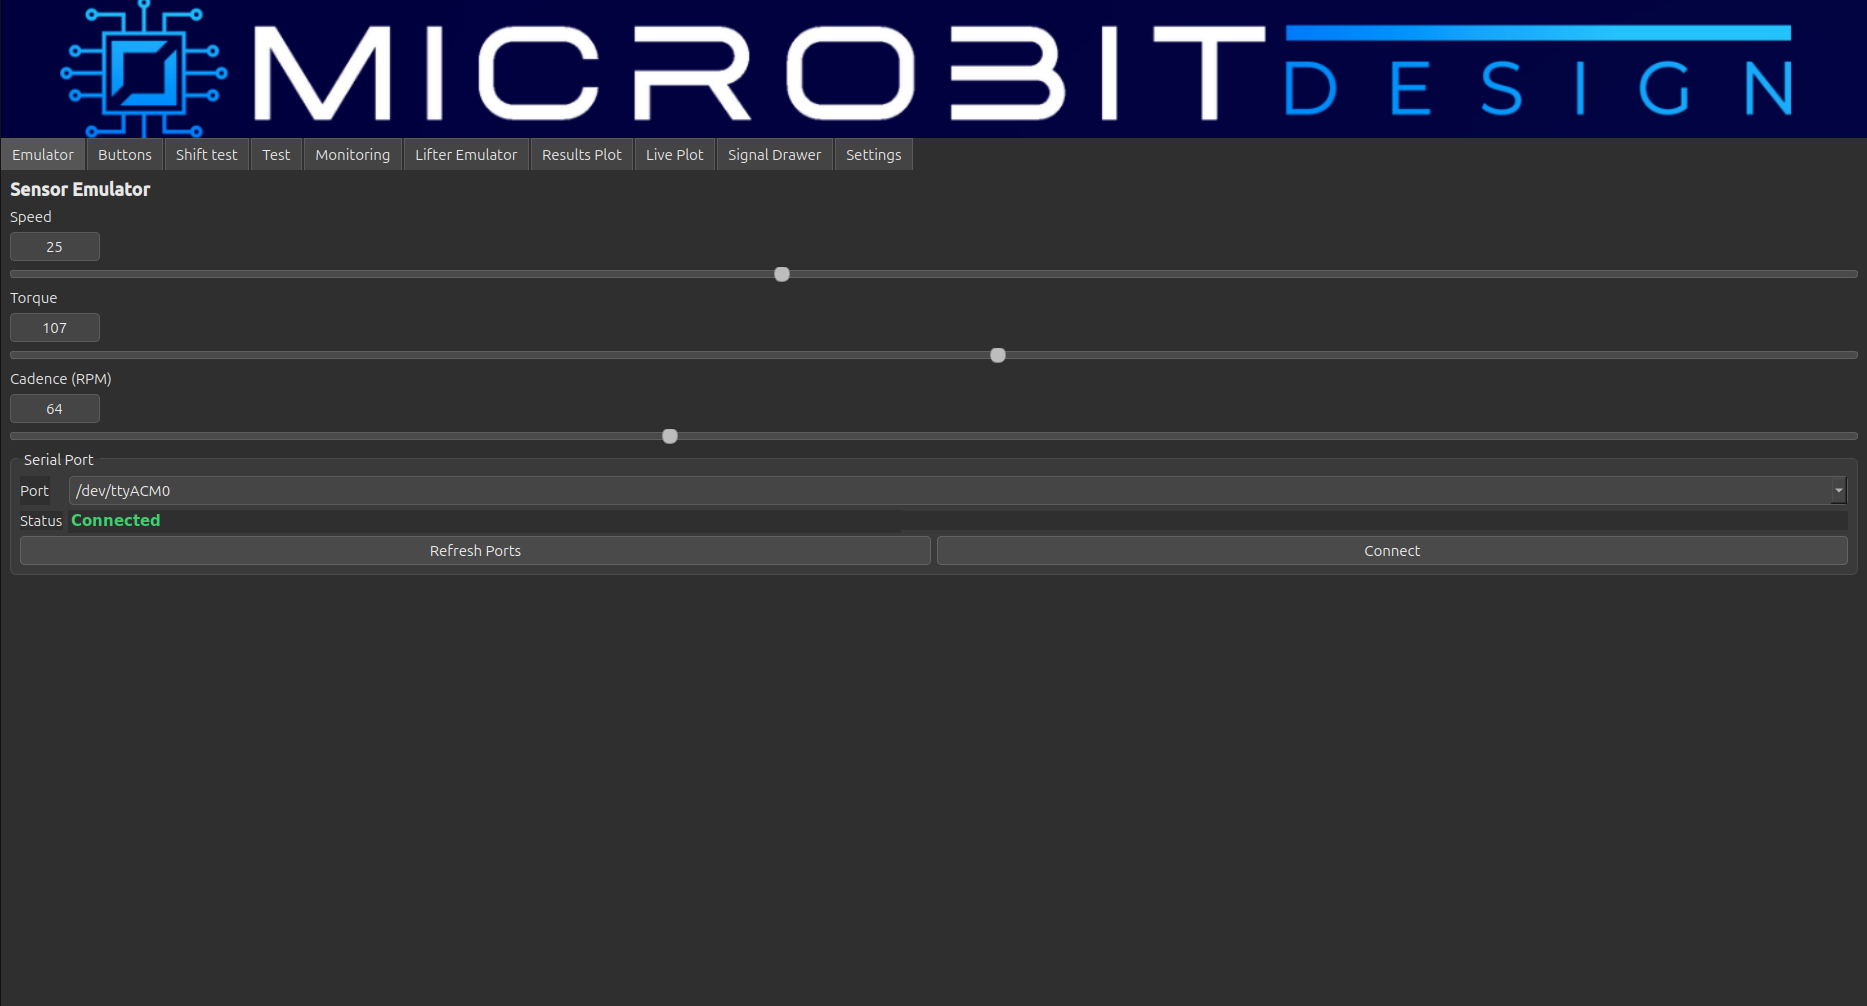
1. Manual speed, torque and cadence
The simplest screen: three sliders. Move one and watch how the firmware reacts. This is what we use most during feature development and quick bench checks.
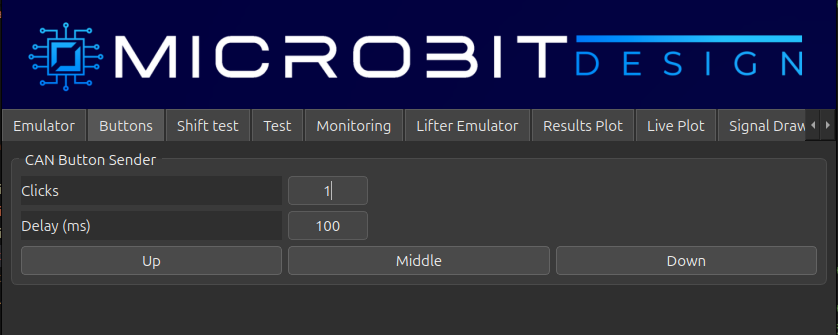
2. Button emulator
Handlebar buttons are part of the system too. The button emulator sends button presses over CAN with a set number of clicks and delay between them, so a tricky button sequence can be reproduced exactly, instead of someone trying to press "up, up, middle" with the right timing.
3. Automated shift tester
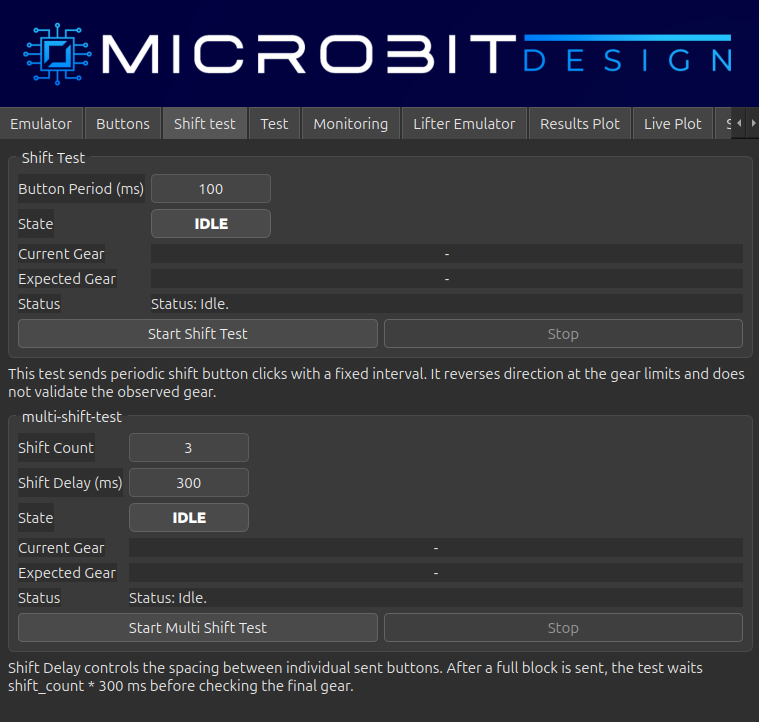
Gear changes are something you want to test thousands of times, and nobody wants to do that by hand. The shift tester runs predefined shift sequences, reads back which gear the system ended up in, and compares it with the gear it expected.
After every firmware change we can rerun the same shift sequence and know straight away if something broke.
4. Live plot
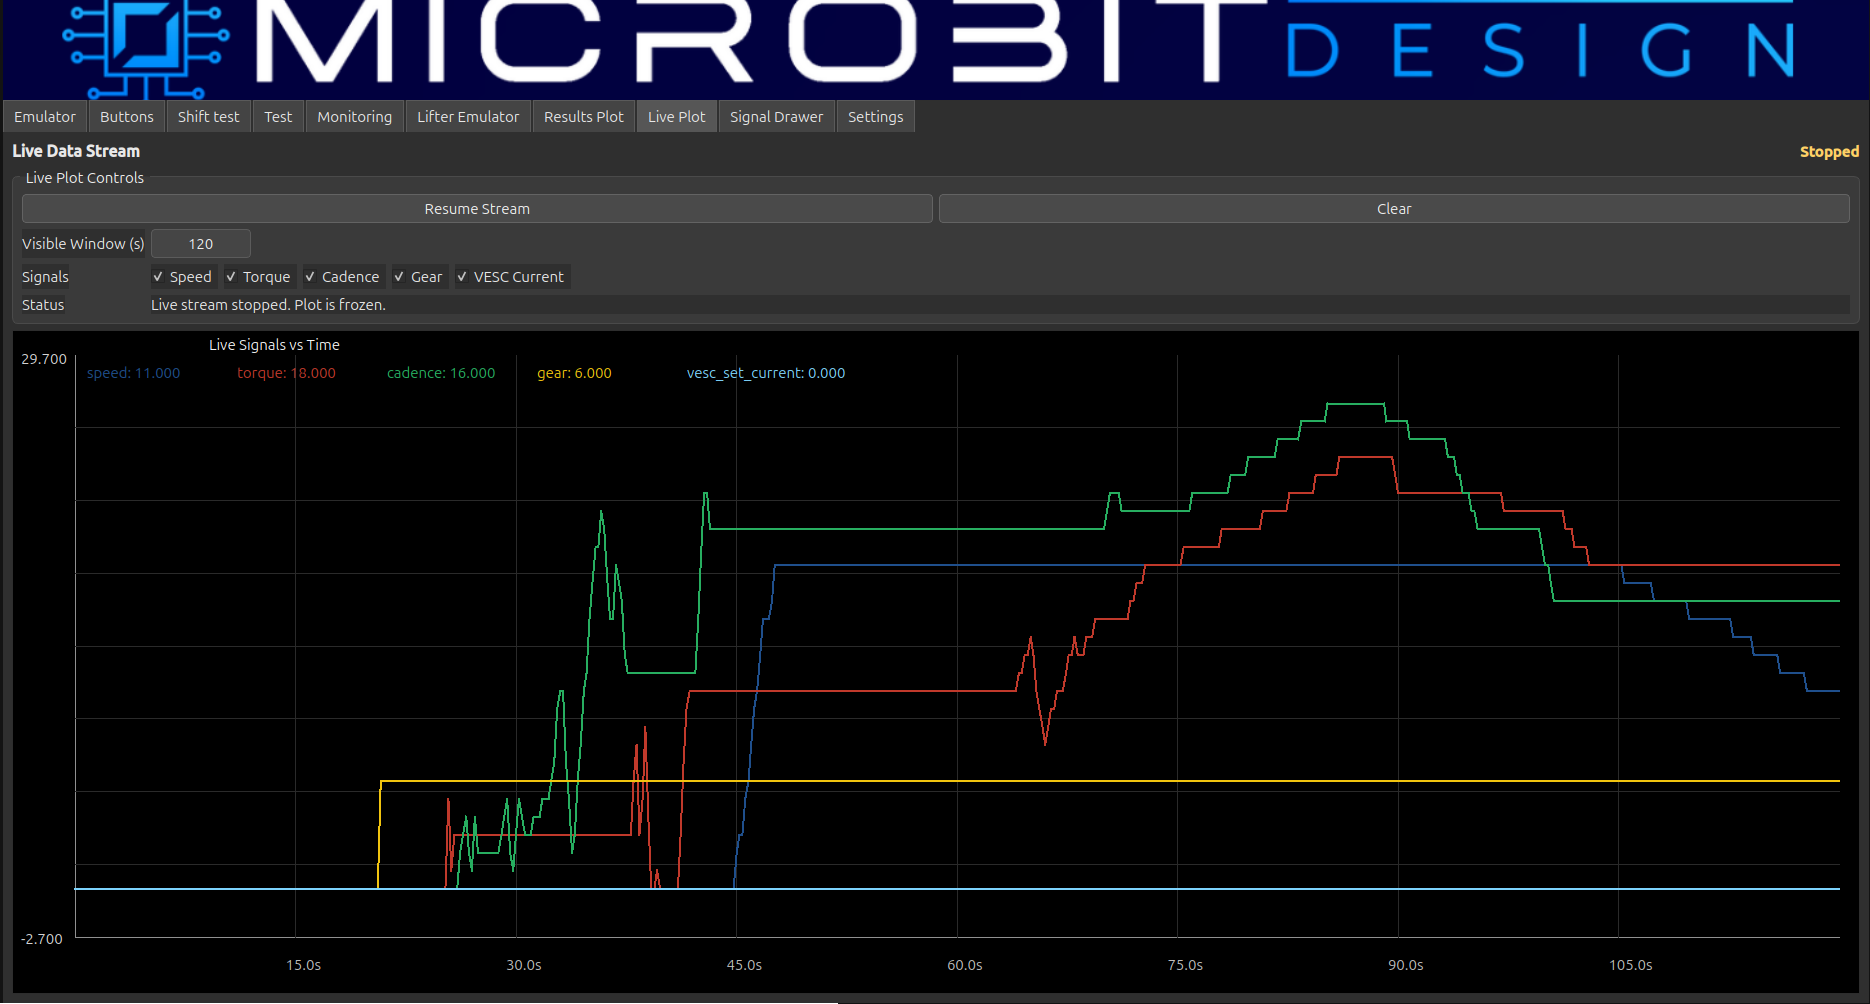
While a test runs, the live plot shows what's happening on the system in real time: speed, torque, cadence, gear and motor current on one timeline. When something looks off, you can see immediately whether it lines up with an input change.
5. Signal drawer and reusable test profiles
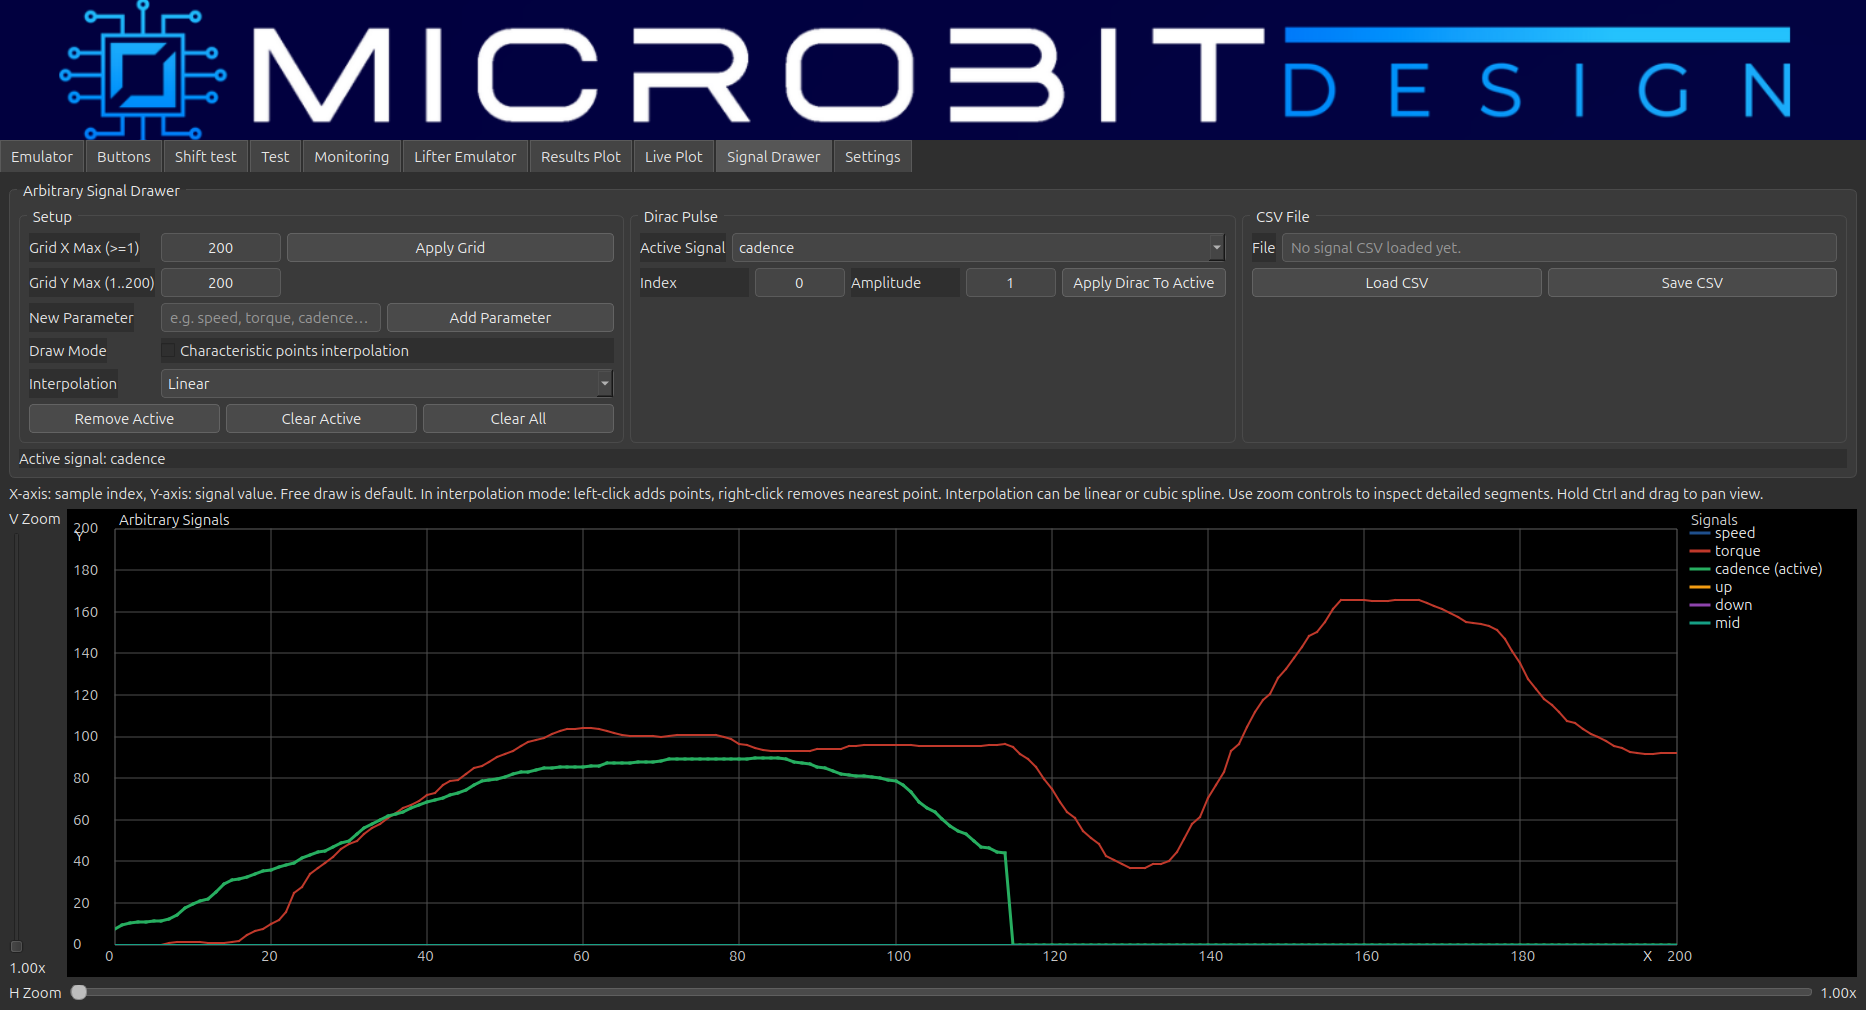
This is the screen we like most. Instead of testing with fixed values, you draw how each signal should change over time: speed, torque, cadence, button presses, and even the pass/fail limits. That's how we reproduce real situations: a rider accelerating from a stop, effort dropping on a climb, cadence spiking when the rider shifts.
Every profile can be saved as a CSV file and loaded again later. A good scenario gets written once and then replayed against every new firmware version, with exactly the same inputs each time. That's what makes regression testing actually useful.
6. Result plotter and analyzer
When a test is finished, the result plotter shows two things together: what the emulator sent, and how the bike responded.
The response comes from the CAN bus. While the emulator generates inputs, the application listens to the bus and records the messages the system sends back. So we're not guessing what the controller did; we see what it reported.
For automated tests, the expected behaviour is drawn on the plot as a pass/fail mask. If the measured response leaves the allowed area at any point, the test fails, and the plot shows exactly when and by how much. A failed test then becomes a starting point for debugging instead of just a red light.
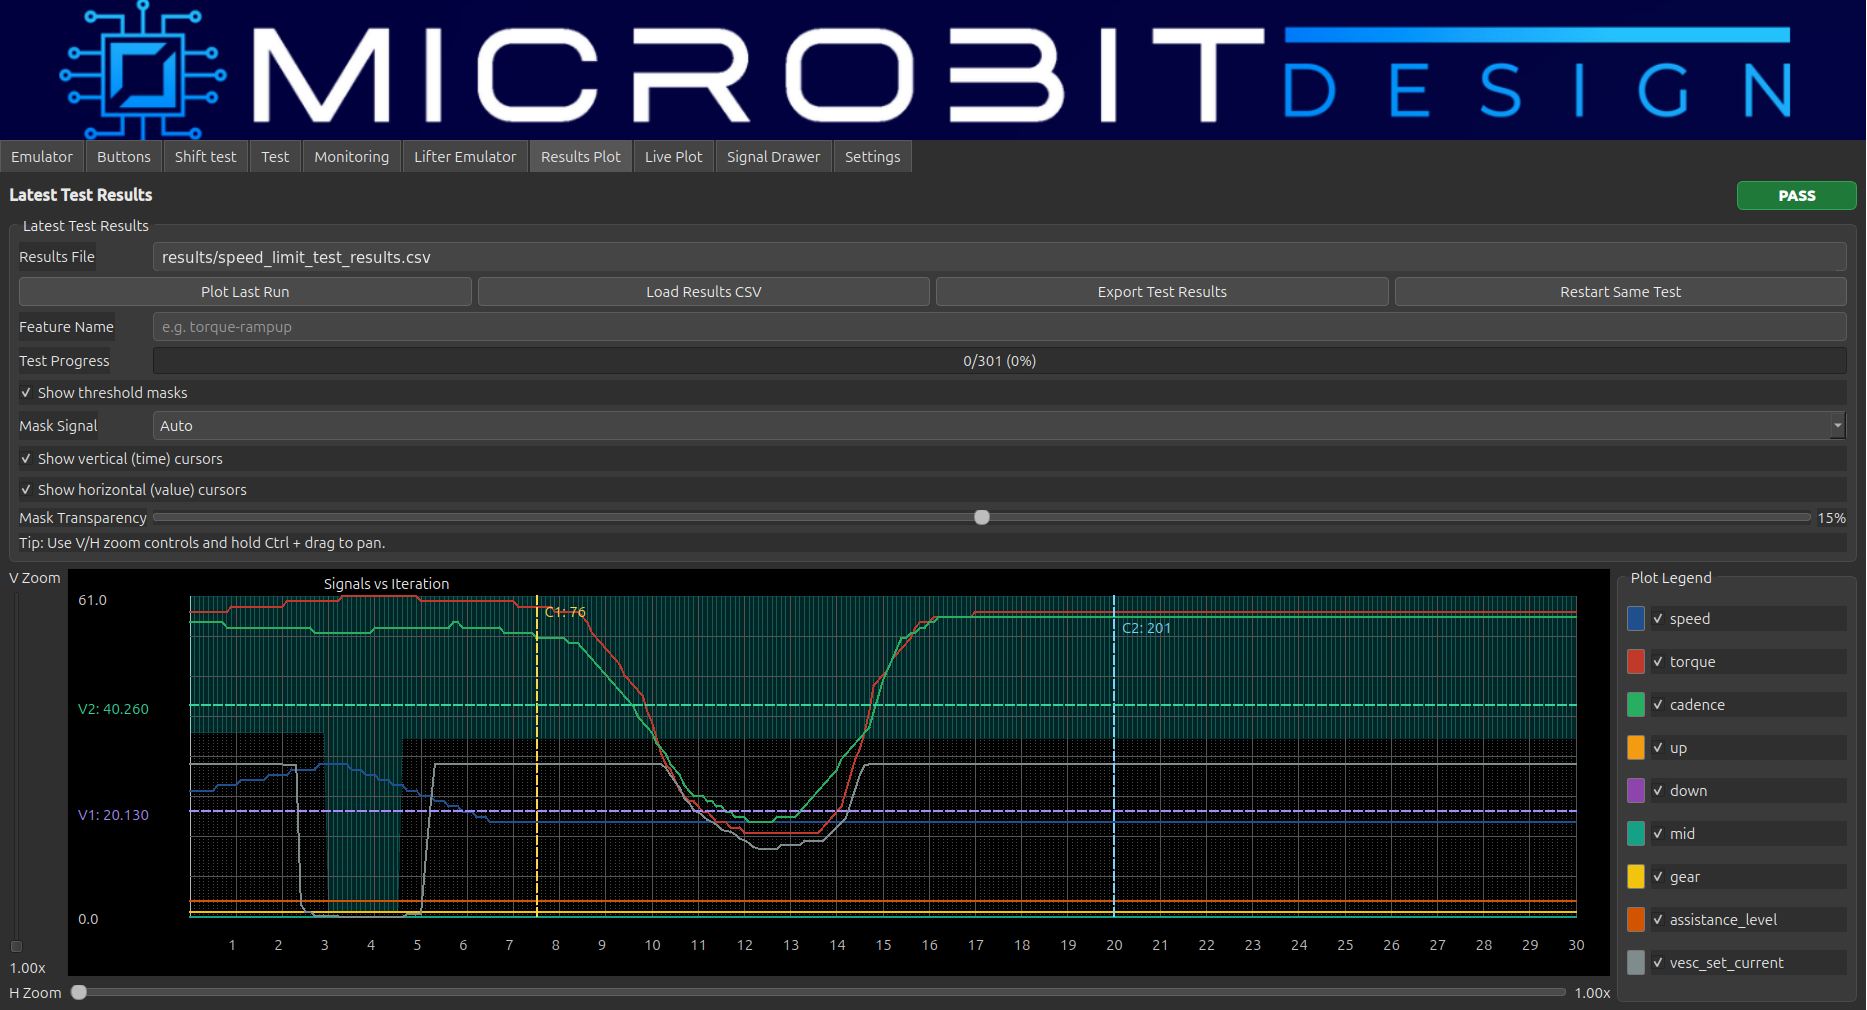
A real example: the 25 km/h limit
The plot above is a real automated test, and an important one. On an e-bike sold in Europe, motor assistance must not continue above the permitted speed. In this test, assistance has to start reducing at 25 km/h and ramp smoothly down to zero before the configured hard limit of 28 km/h.
The emulator drives the speed through that range while the application watches the system's response on the CAN bus. The measured assistance stays inside the pass/fail mask the whole way down and reaches zero where it should. Test passed, and it will run again, identically, after every firmware change.
Why it was worth building
A lot of firmware work moved from the bike to the bench, and the bench is a much nicer place to debug:
we kept developing while sensors and mechanical parts were still missing,
tests are repeatable instead of depending on how someone happened to ride,
CSV profiles turned into a growing library of regression tests,
shift testing that used to be tedious now runs on its own,
when something fails, we see when and how, not just that it failed.
It doesn't replace testing on a real bike. Final validation still happens on the road. But most functional testing and debugging now happens in a controlled environment, where a scenario can be repeated in seconds and every firmware build gets the same treatment.
The team
The emulator was a team effort. Tarik Subašić designed the hardware and the 3D-printed enclosure, Mahir Alić did the PCB design, firmware and desktop software, and Semir Tursunović led the project.
Working on e-mobility firmware and need a way to test it properly before it hits the road? Let's talk.